Please note the following for credit and use of all data:
The scientists the BES-LTER Program and the Cary Institute of Ecosystem Studies must receive adequate acknowledgement for the use of data. Please inform the BES Project Facilitator and use a statement such as the following to give credit on any document using the data: 'Data was supported by the Baltimore Ecosystem Study'
Metadata from: http://www.beslter.org/metacat_harvest_attribute_level_eml/html_metadata/bes_2070.asp
An ongoing component of the Baltimore urban long-term ecological research (LTER) project (Baltimore Ecosystem Study, BES) is the use of the watershed approach and monitoring of stream water quality to evaluate the integrated ecosystem functioning of Baltimore. The LTER research has focused on the Gwynns Falls watershed, which spans a gradient from highly urban, urban-residential, and suburban zones. In addition, a forested watershed serves as a reference. The long-term sampling network includes four longitudinal sampling sites along the Gwynns Falls mainstem, as well as several small (40-100 ha) watershed within or near the Gwynns Falls, providing data on water quality in different land use zones of the watersheds. Each study site is continuously monitored for discharge and is sampled weekly for water chemistry. Those data are available elsewhere on the BES website.
We are interested in studying the bioreactivity of streams in our watersheds in an attempt to quantify how streams themselves may affect or be affected by water quality. To assess the bioreactivity of streams, we measure whole stream metabolism, which is an integrative metric which quantifies the production and consumption of energy by a stream ecosystem. Stream metabolism represents how energy is created (primary production) and used (respiration) within a stream; it can be thought of as a stream breathing, with primary production being similar to an inhale, and respiration as an exhale.
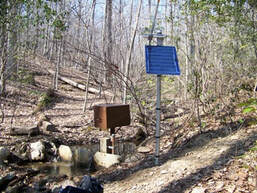
We have begun monitoring stream metabolism in each of our long-term water quality monitoring stations by deploying sensors that record dissolve oxygen and temperature of the stream every five minutes, and we also have deployed light sensors to record irradiance every five minutes at long-term BES water chemistry streams, which is needed for metabolism modeling. In addition, each dissolved oxygen sensor is located near a USGS gage which estimates discharge every 15 minutes. We used USGS manual discharge estimations linked with channel geometry measurements to develop a unique discharge-stream depth relationship (contact AJ Reisinger for details). The combination of the USGS discharge data and our discharge-depth relationship allows us to estimate average daily discharge and depth. We have included these data as well as dissolved oxygen, temperature, and PAR, allowing metabolism to be scaled on an areal basis. Primary production and respiration of streams integrate all biological activity in a stream, and therefore are good metrics to assess the state of an ecosystem. These metrics can also be used to predict other ecosystem functions.
This dataset includes all information needed for whole-stream metabolism modeling. The initial dataset is limited to a subset of preliminary sensor deployments, but data will updated as it becomes available from the core stream study sites (see http://md.water.usgs.gov/BES for a detailed description of these sites).
METHODS
Dissolved oxygen and temperature are logged every five minutes on a miniDOT (PME, Inc.) deployed at a representative location in the stream. Irradiance (I) is recorded as photosynthetically active radiation (PAR) using Odyssey loggers (Dataflow Systems Limited, Christchurch, NZ) deployed at a representative location near the stream. Elevation is estimated using Google Earth.
Average daily discharge is downloaded from USGS gauging stations located at each individual study site. We developed site-specific depth-discharge relationships using USGS manual discharge measurements with channel geometry. These specific relationships are then used to back-calculate average stream depth from daily average Q downloaded from USGS.
Beginning in 2016, miniDOTs will be deployed continuously at each long-term BES water chemistry site. During continuous deployment, miniDOTs will be cleaned weekly, and downloaded quarterly. miniDOTs will be calibrated annually per manufacturer recommendation. miniDOTs are logged together in supersaturated water for one hour prior to and after deployment. This equilibration period allows for any drift correction over the course of the deployment.
Additional notes from AJ Reisinger:
I ended up using USGS discharge measurements to develop a Q:depth relationship based on all discharge measurements they've completed for each gage (anywhere from 150 - >600 measurements) and then applied either a logarithmic or power-law relationship (whichever fit the data better) to estimate mean stream depth based on discharge. I then applied this site-specific relationship to the entire discharge record. Unfortunately, discharge readings from USGS didn't have the same time-step as our miniDOT loggers, so after getting a depth estimate for each discharge value from the USGS, I calculated an average daily depth, and then set that average daily depth to correspond to every discharge reading on that respective date. I have scripts for this entire process (other than actually quantifying the relationship, which I did in excel) if anyone is interested in seeing the nuts and bolts.
ADDITIONAL LINKS
Stream Chemistry MetaData from Peter Groffman:
http://www.beslter.org/metacat_harvest_attribute_level_eml/html_metadata/bes_700.asp
USGS information: https://md.water.usgs.gov/BES/
Map and individual description per site: http://www.beslter.org/virtual_tour/index.html - rain gage station, usgs numbers,
